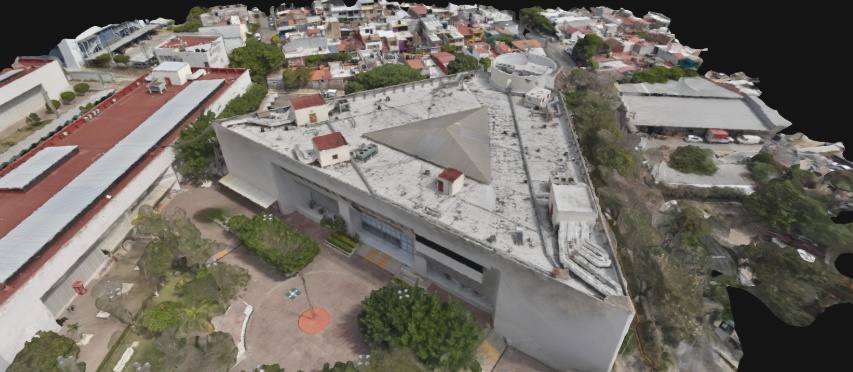
Not all abnormalities are visible to the naked eye

FromInvisible Radiationto an Accurate Diagnosis

01Radiometric Image

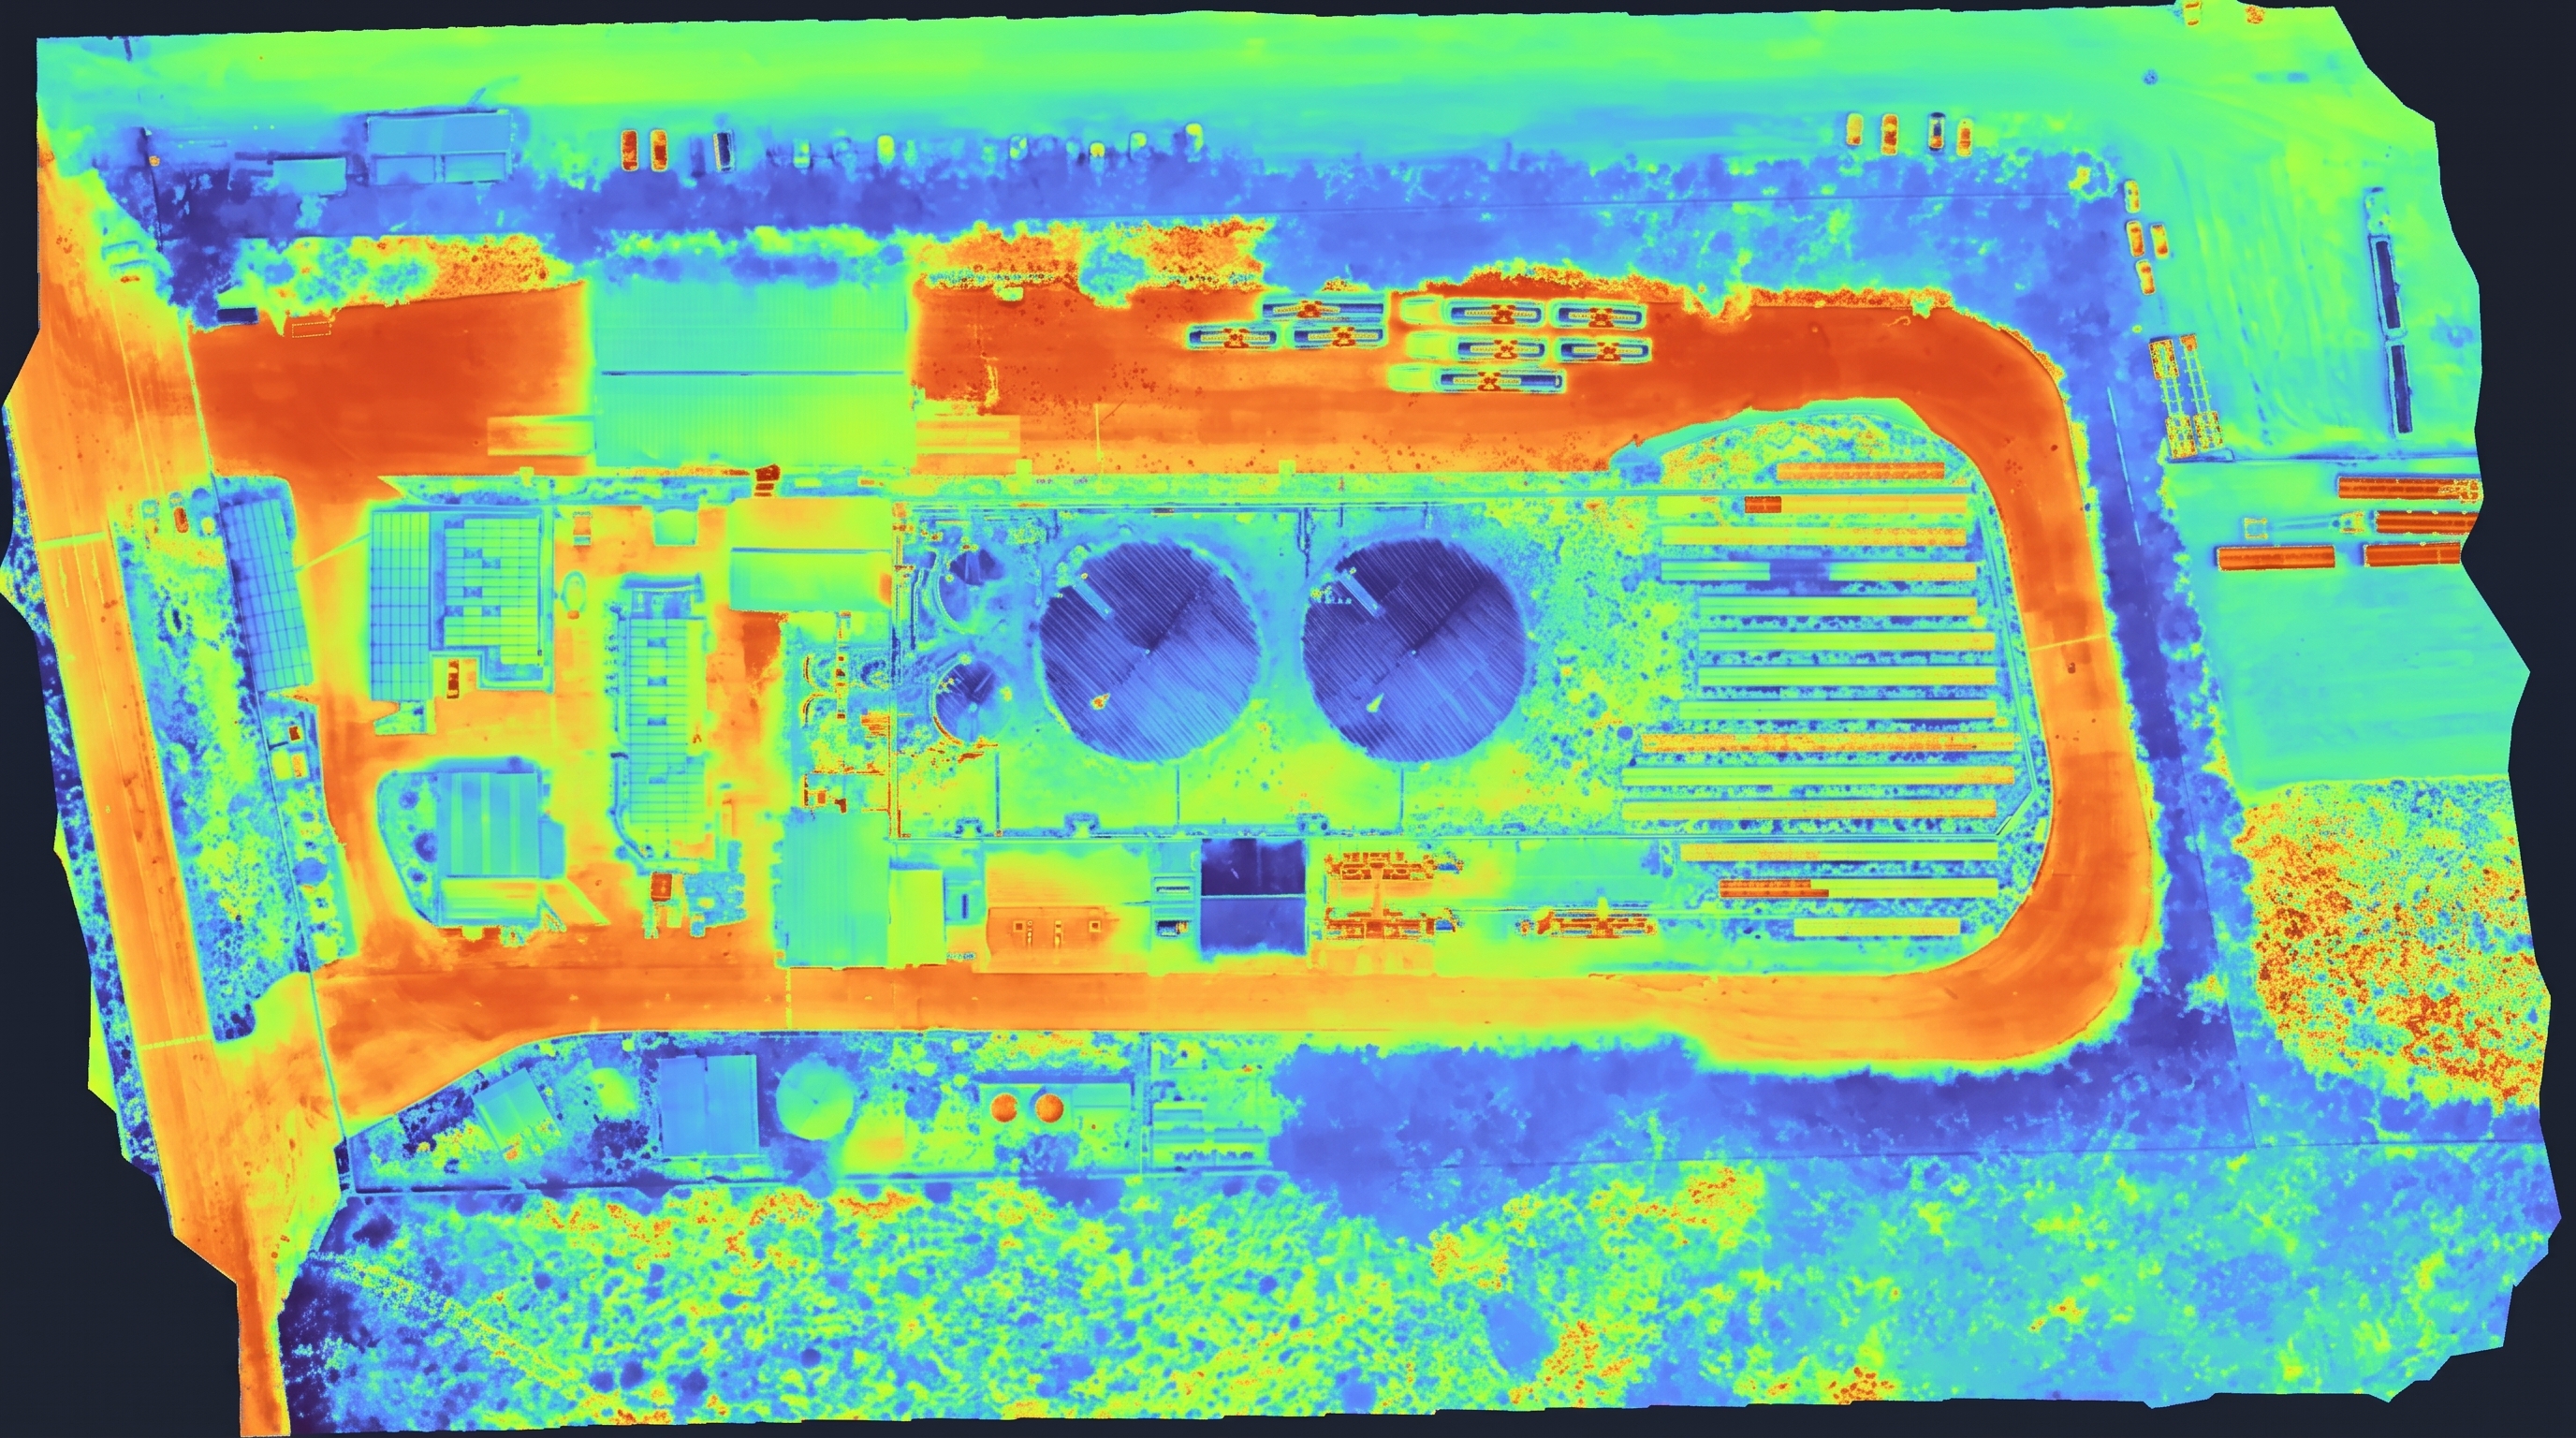
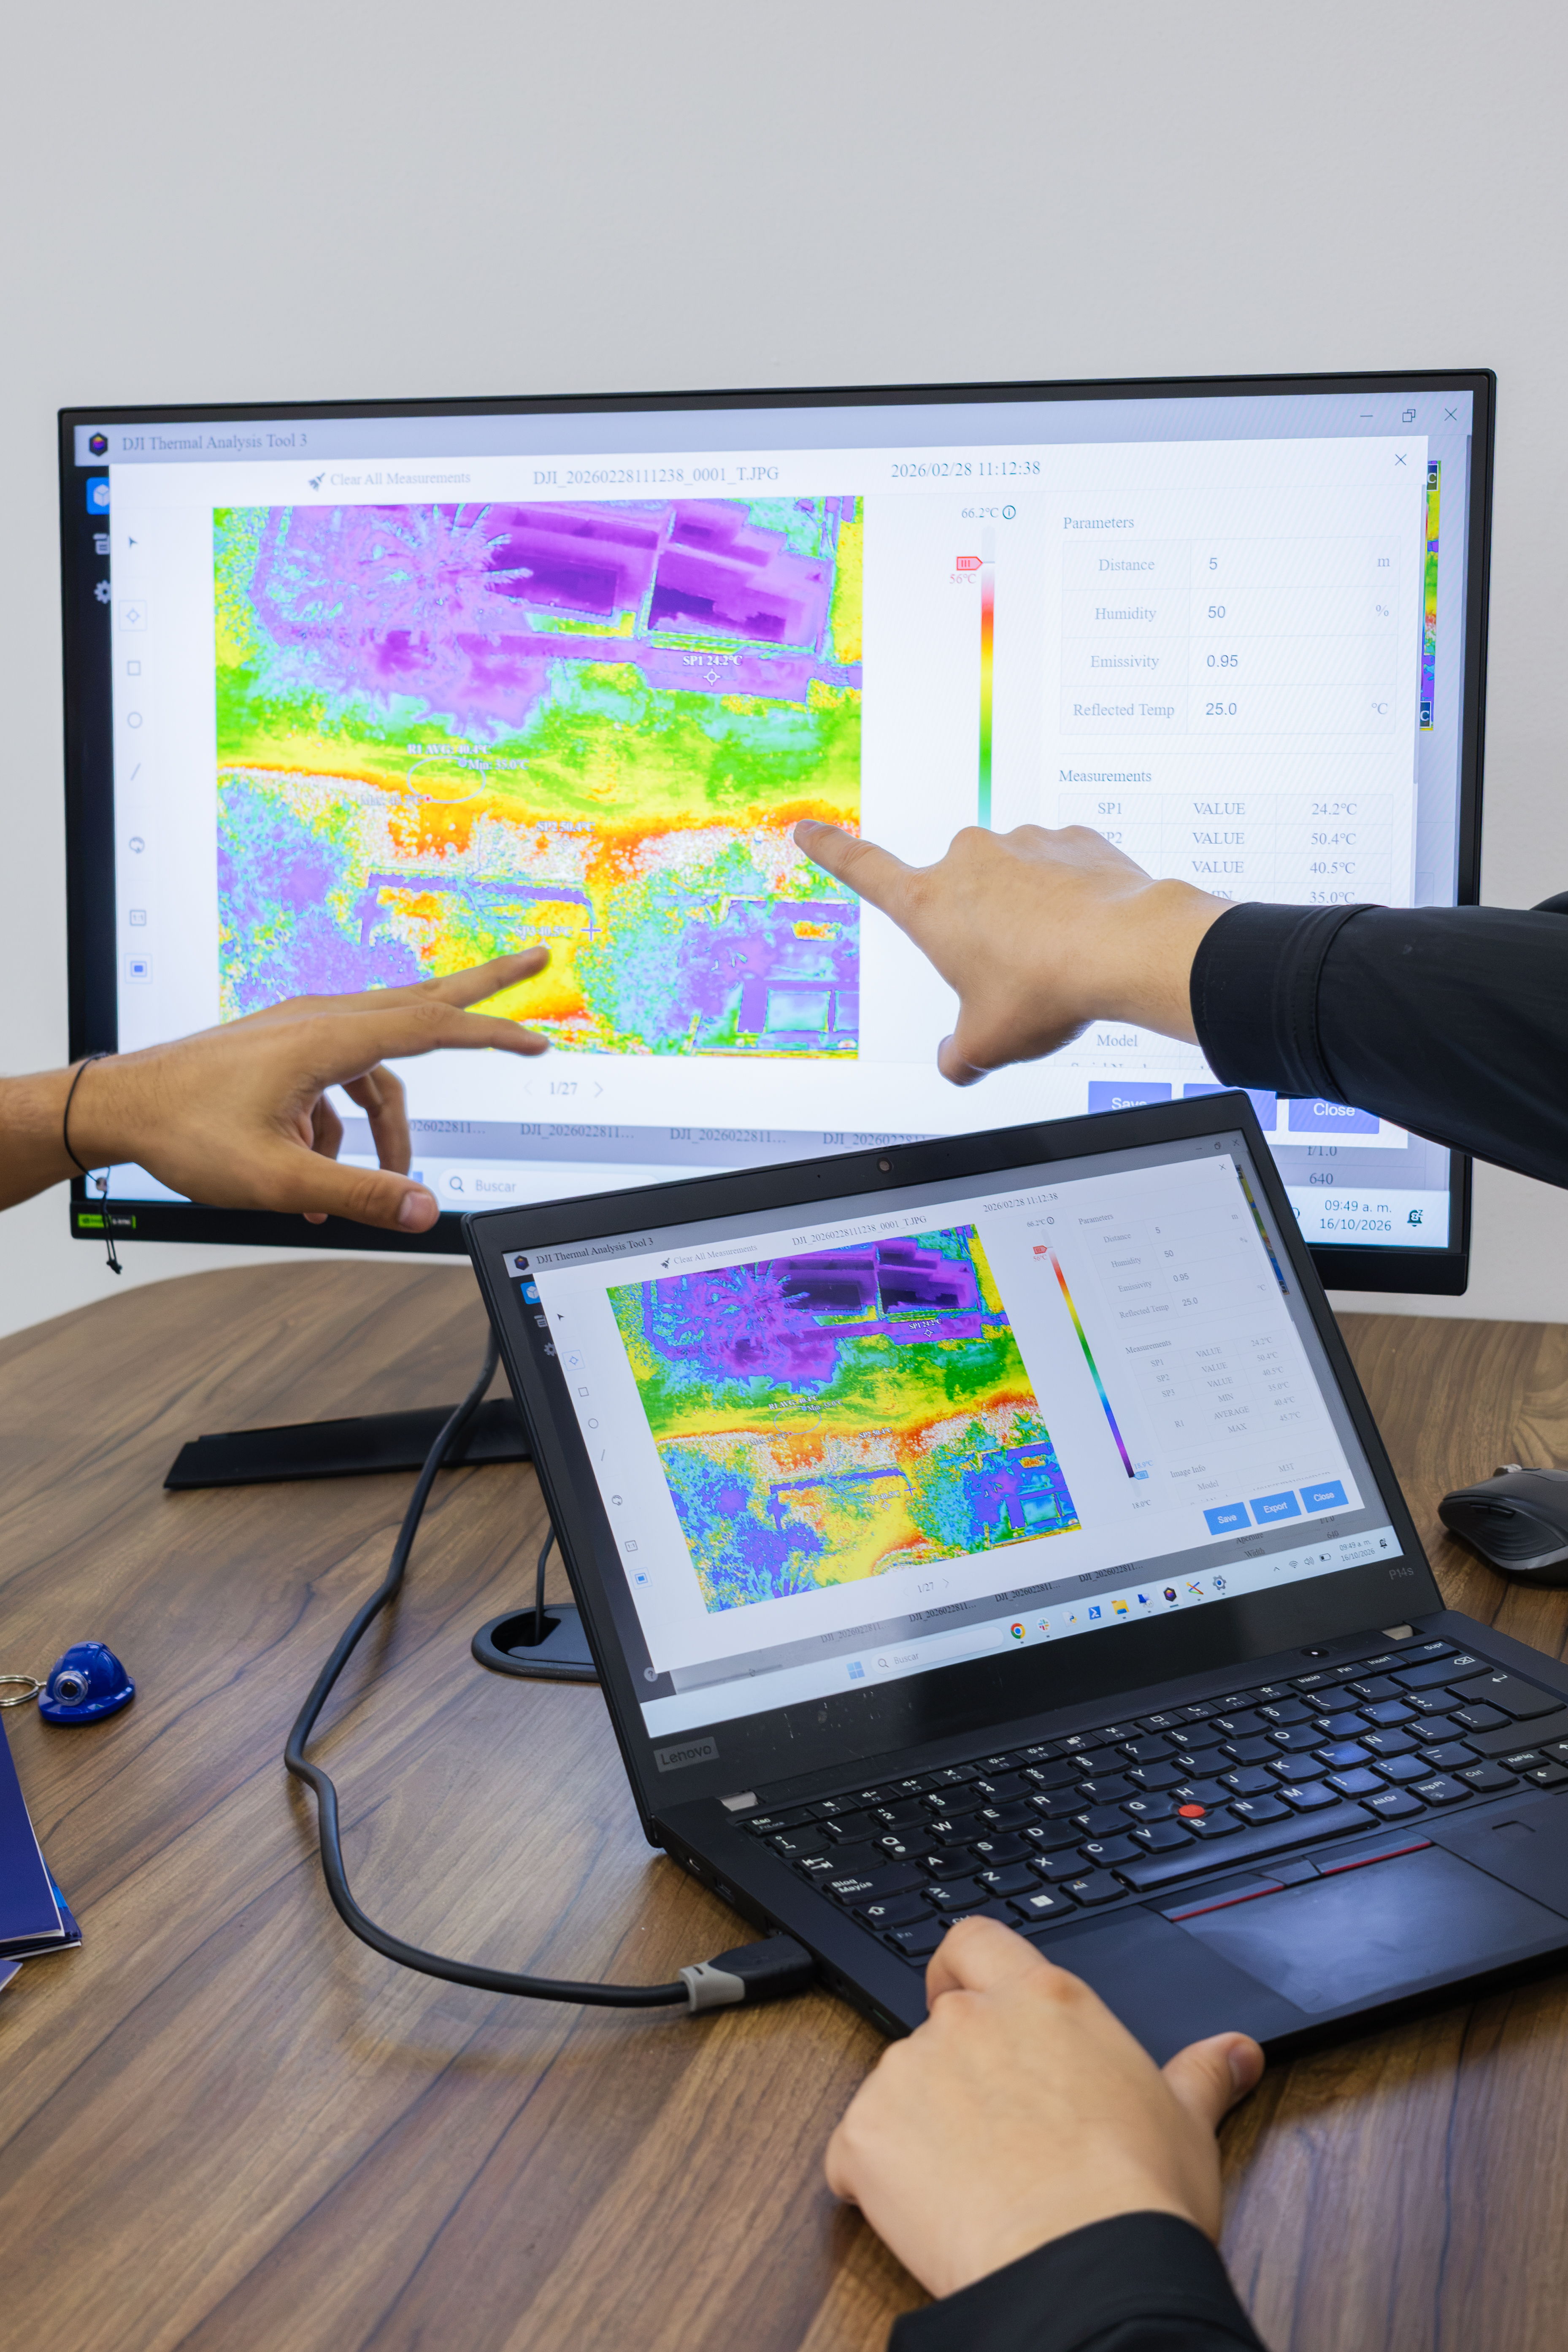
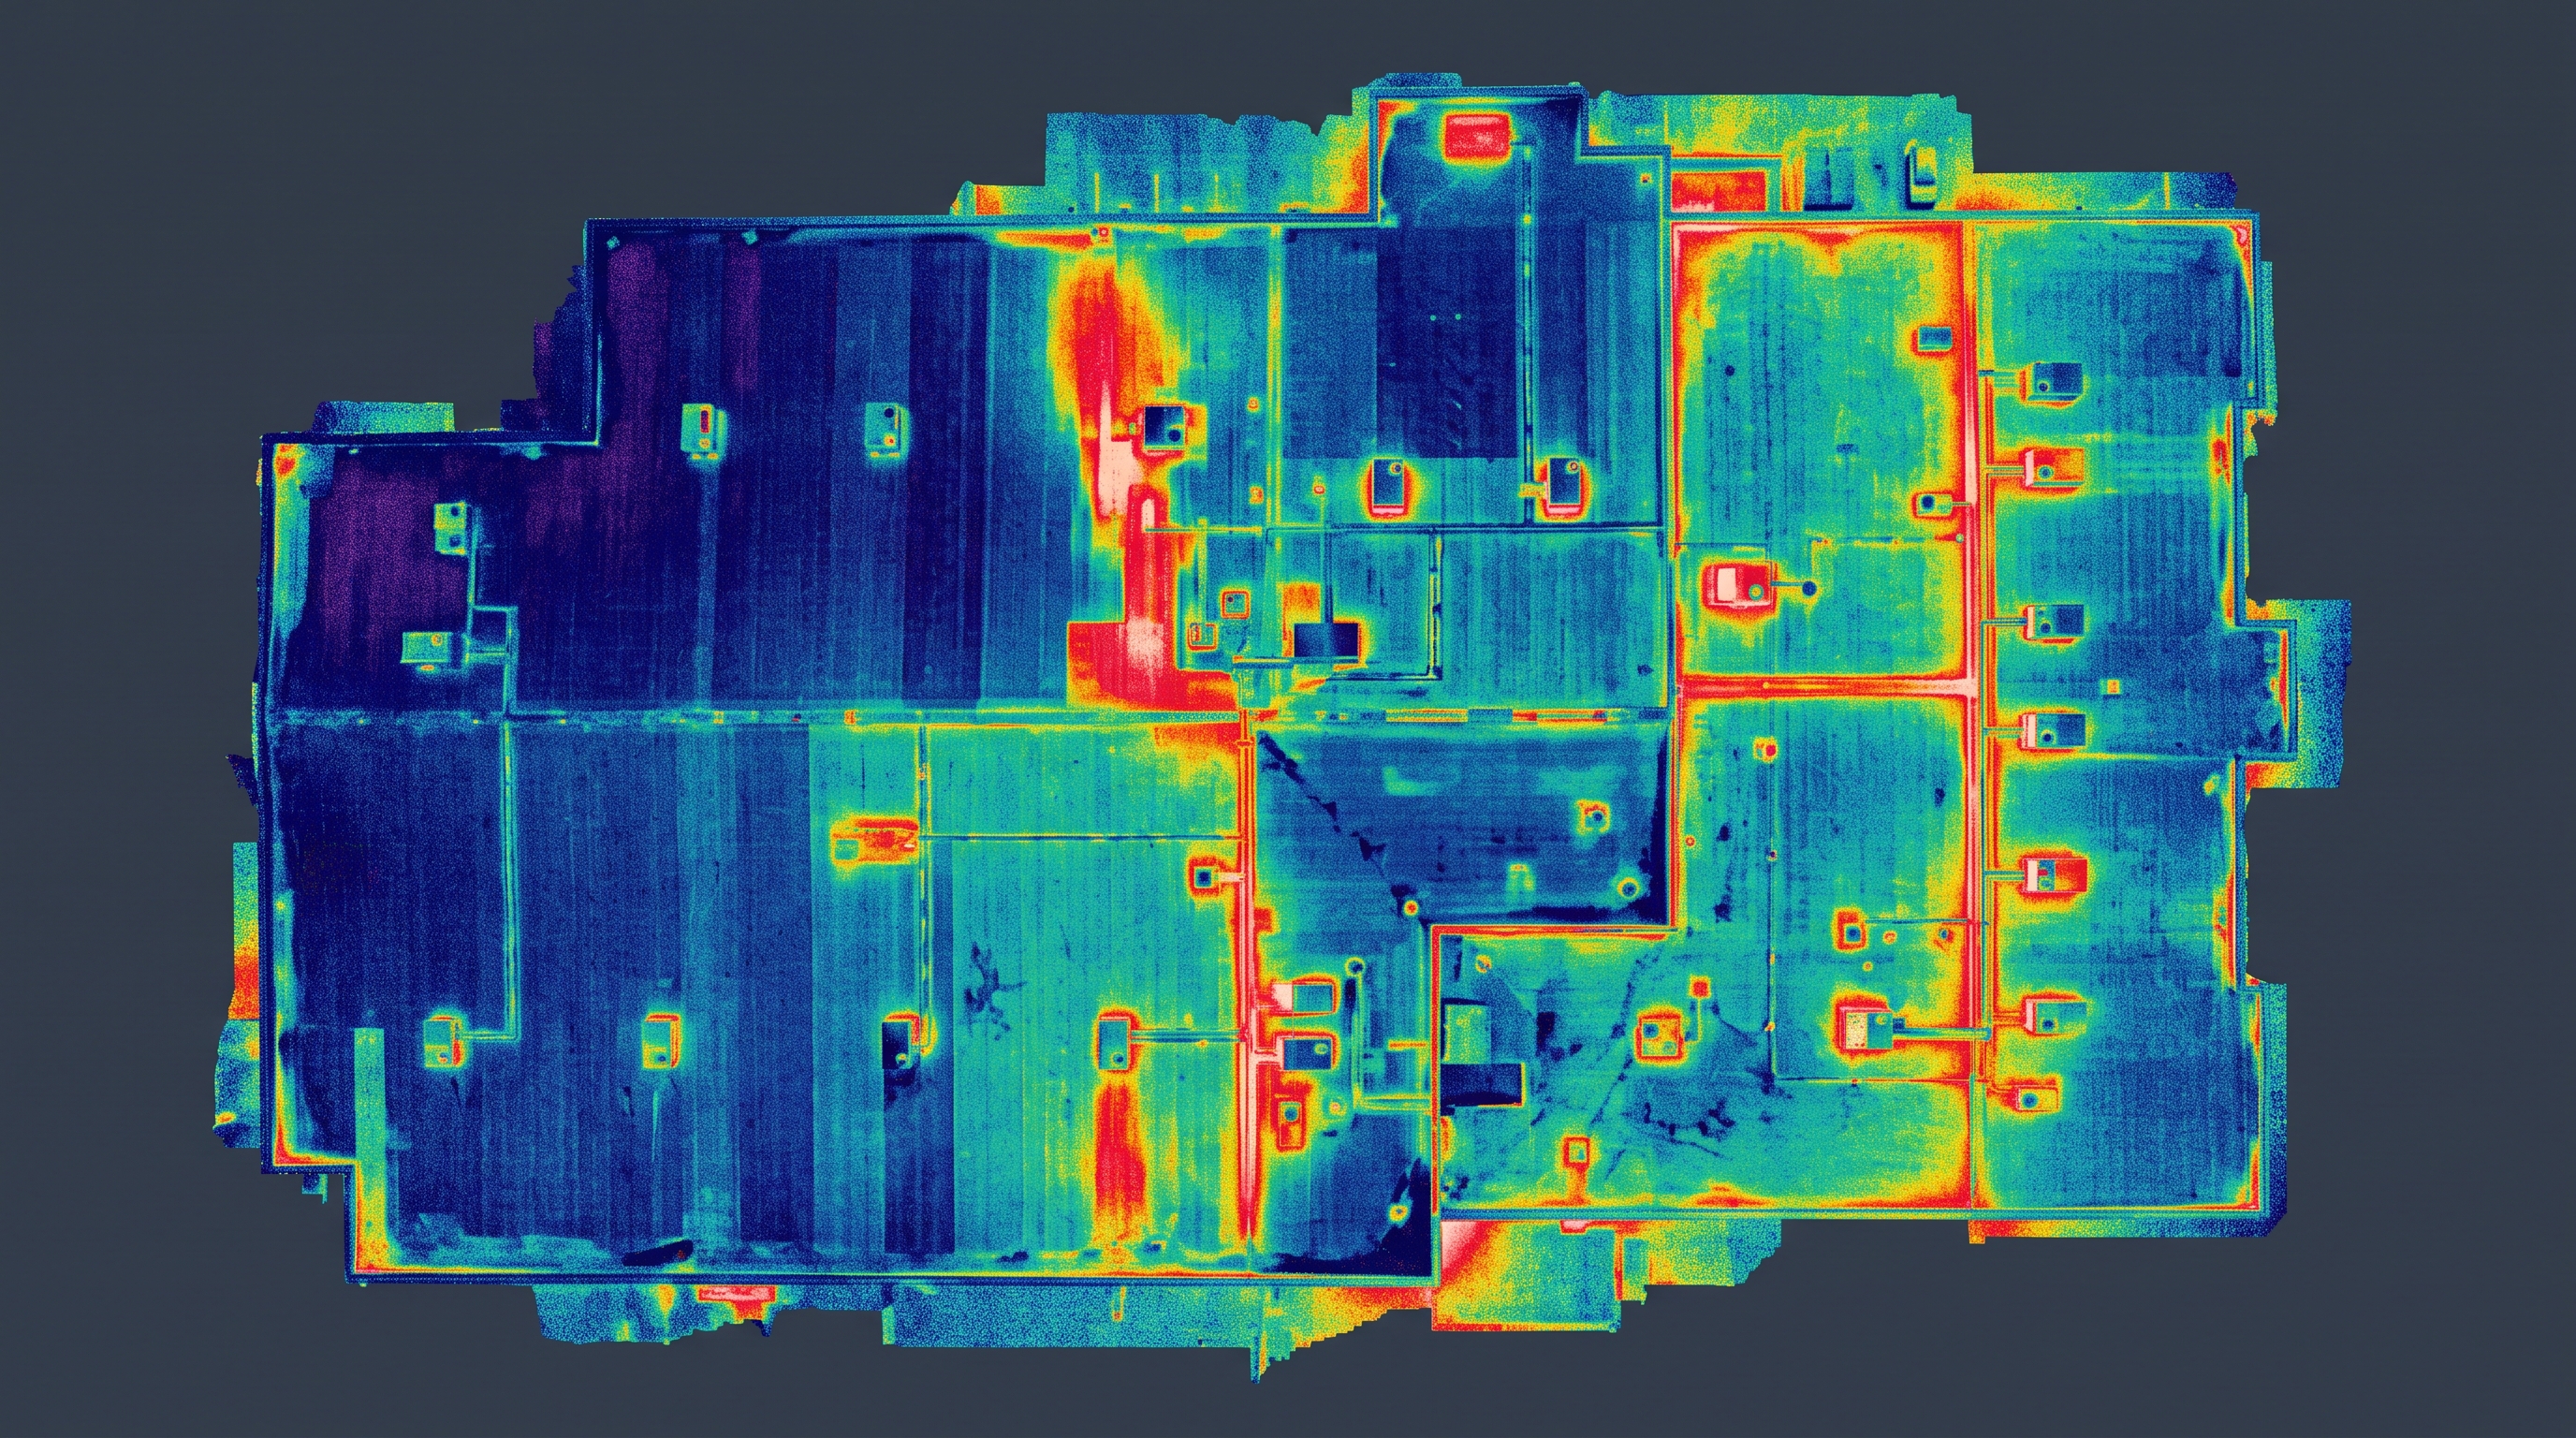
The drone, equipped with a radiometric thermal camera, scans the structure by capturing infrared radiation and assigning an absolute temperature value to each pixel, calibrated according to the emissivity (ability to emit heat) of the roof materials.

02Thermal Inertia

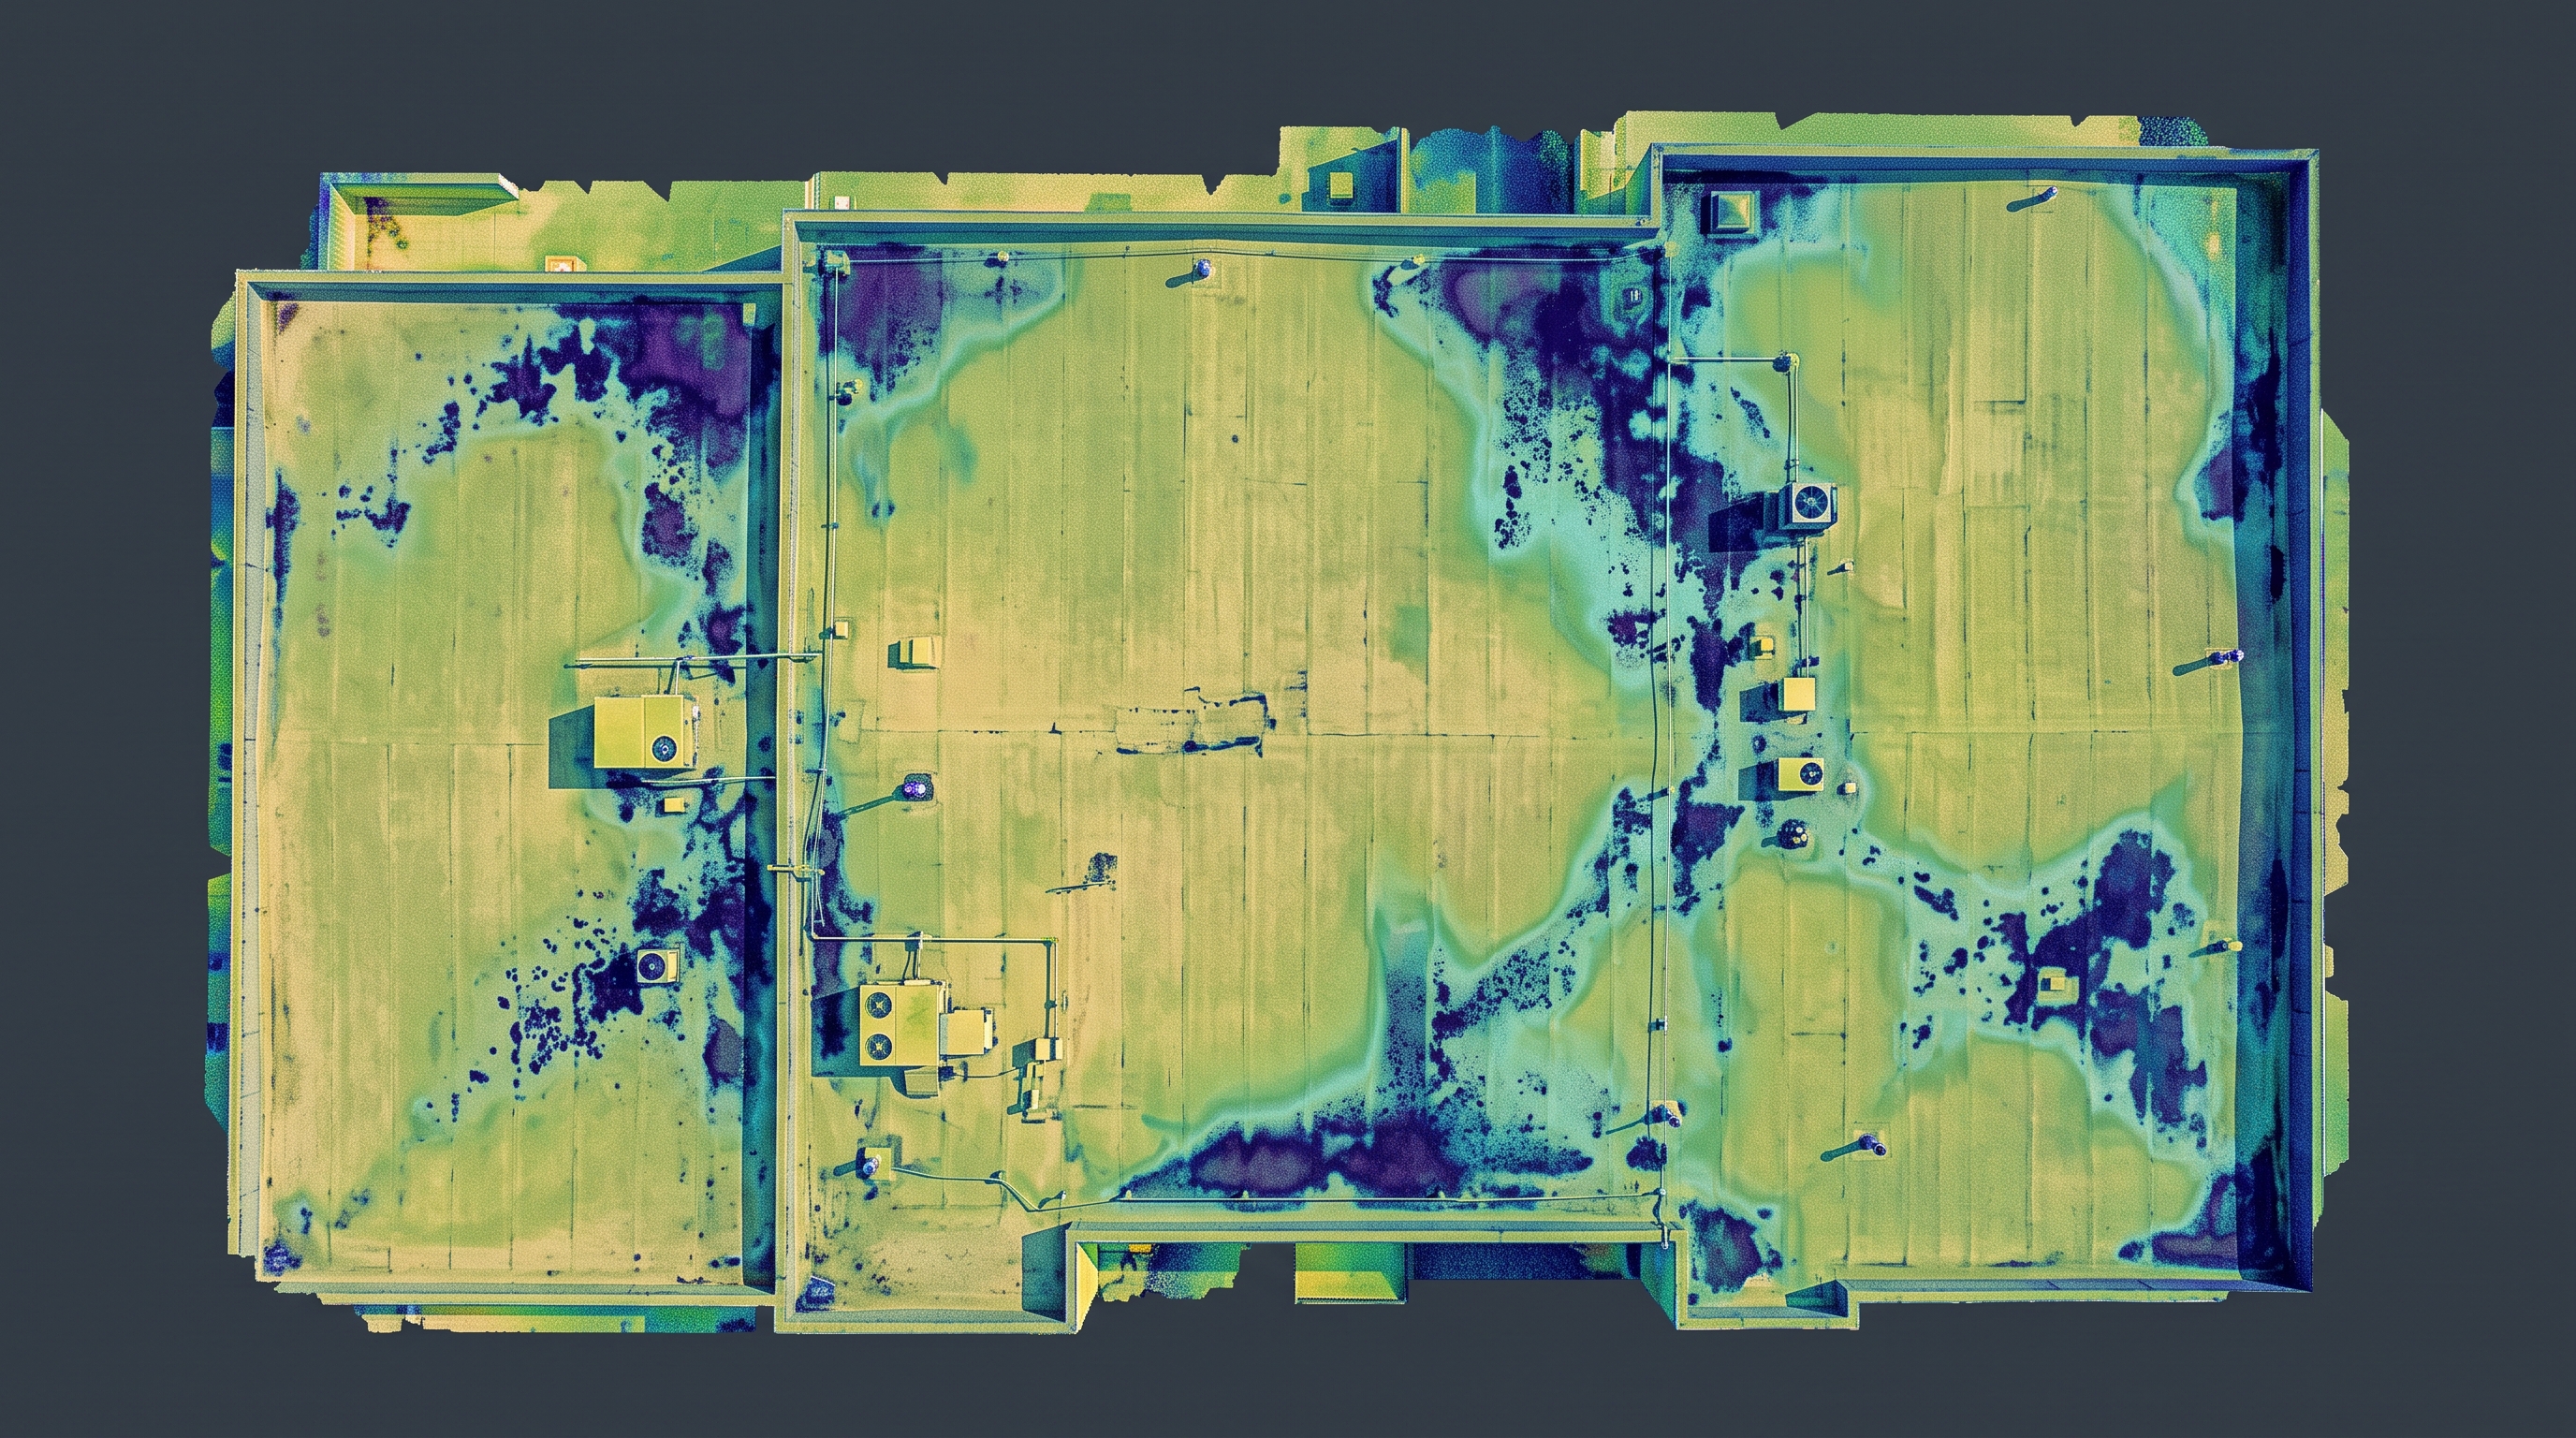
While dry surfaces change temperature rapidly, areas with water or moisture trapped beneath the concrete exhibit a different kind of "thermal inertia": they retain heat longer after exposure to the sun or cool down at a different rate.

03AnalysisUsing MDS

We cross-referenced the thermal data with a Digital Elevation Model (DEM) generated during the same flight: we mapped the temperature anomalies and calculated the slopes to simulate the runoff paths.

This is how we transform invisible radiation signatures and three-dimensional geometry into an accurate, georeferenced assessment, defining—centimeter by centimeter—the critical areas and the actual volume of material needed for the repair.

What is it?

The temperature that reveals what the eye cannot see

Thermography uses thermal cameras to detect temperature differences in buildings, equipment, and facilities. At DAUCH, we capture and analyze these images to identify potential anomalies, such as overheating, areas with signs of moisture, or heat loss, generating technical information that helps assess the condition of infrastructure and guide maintenance decisions.
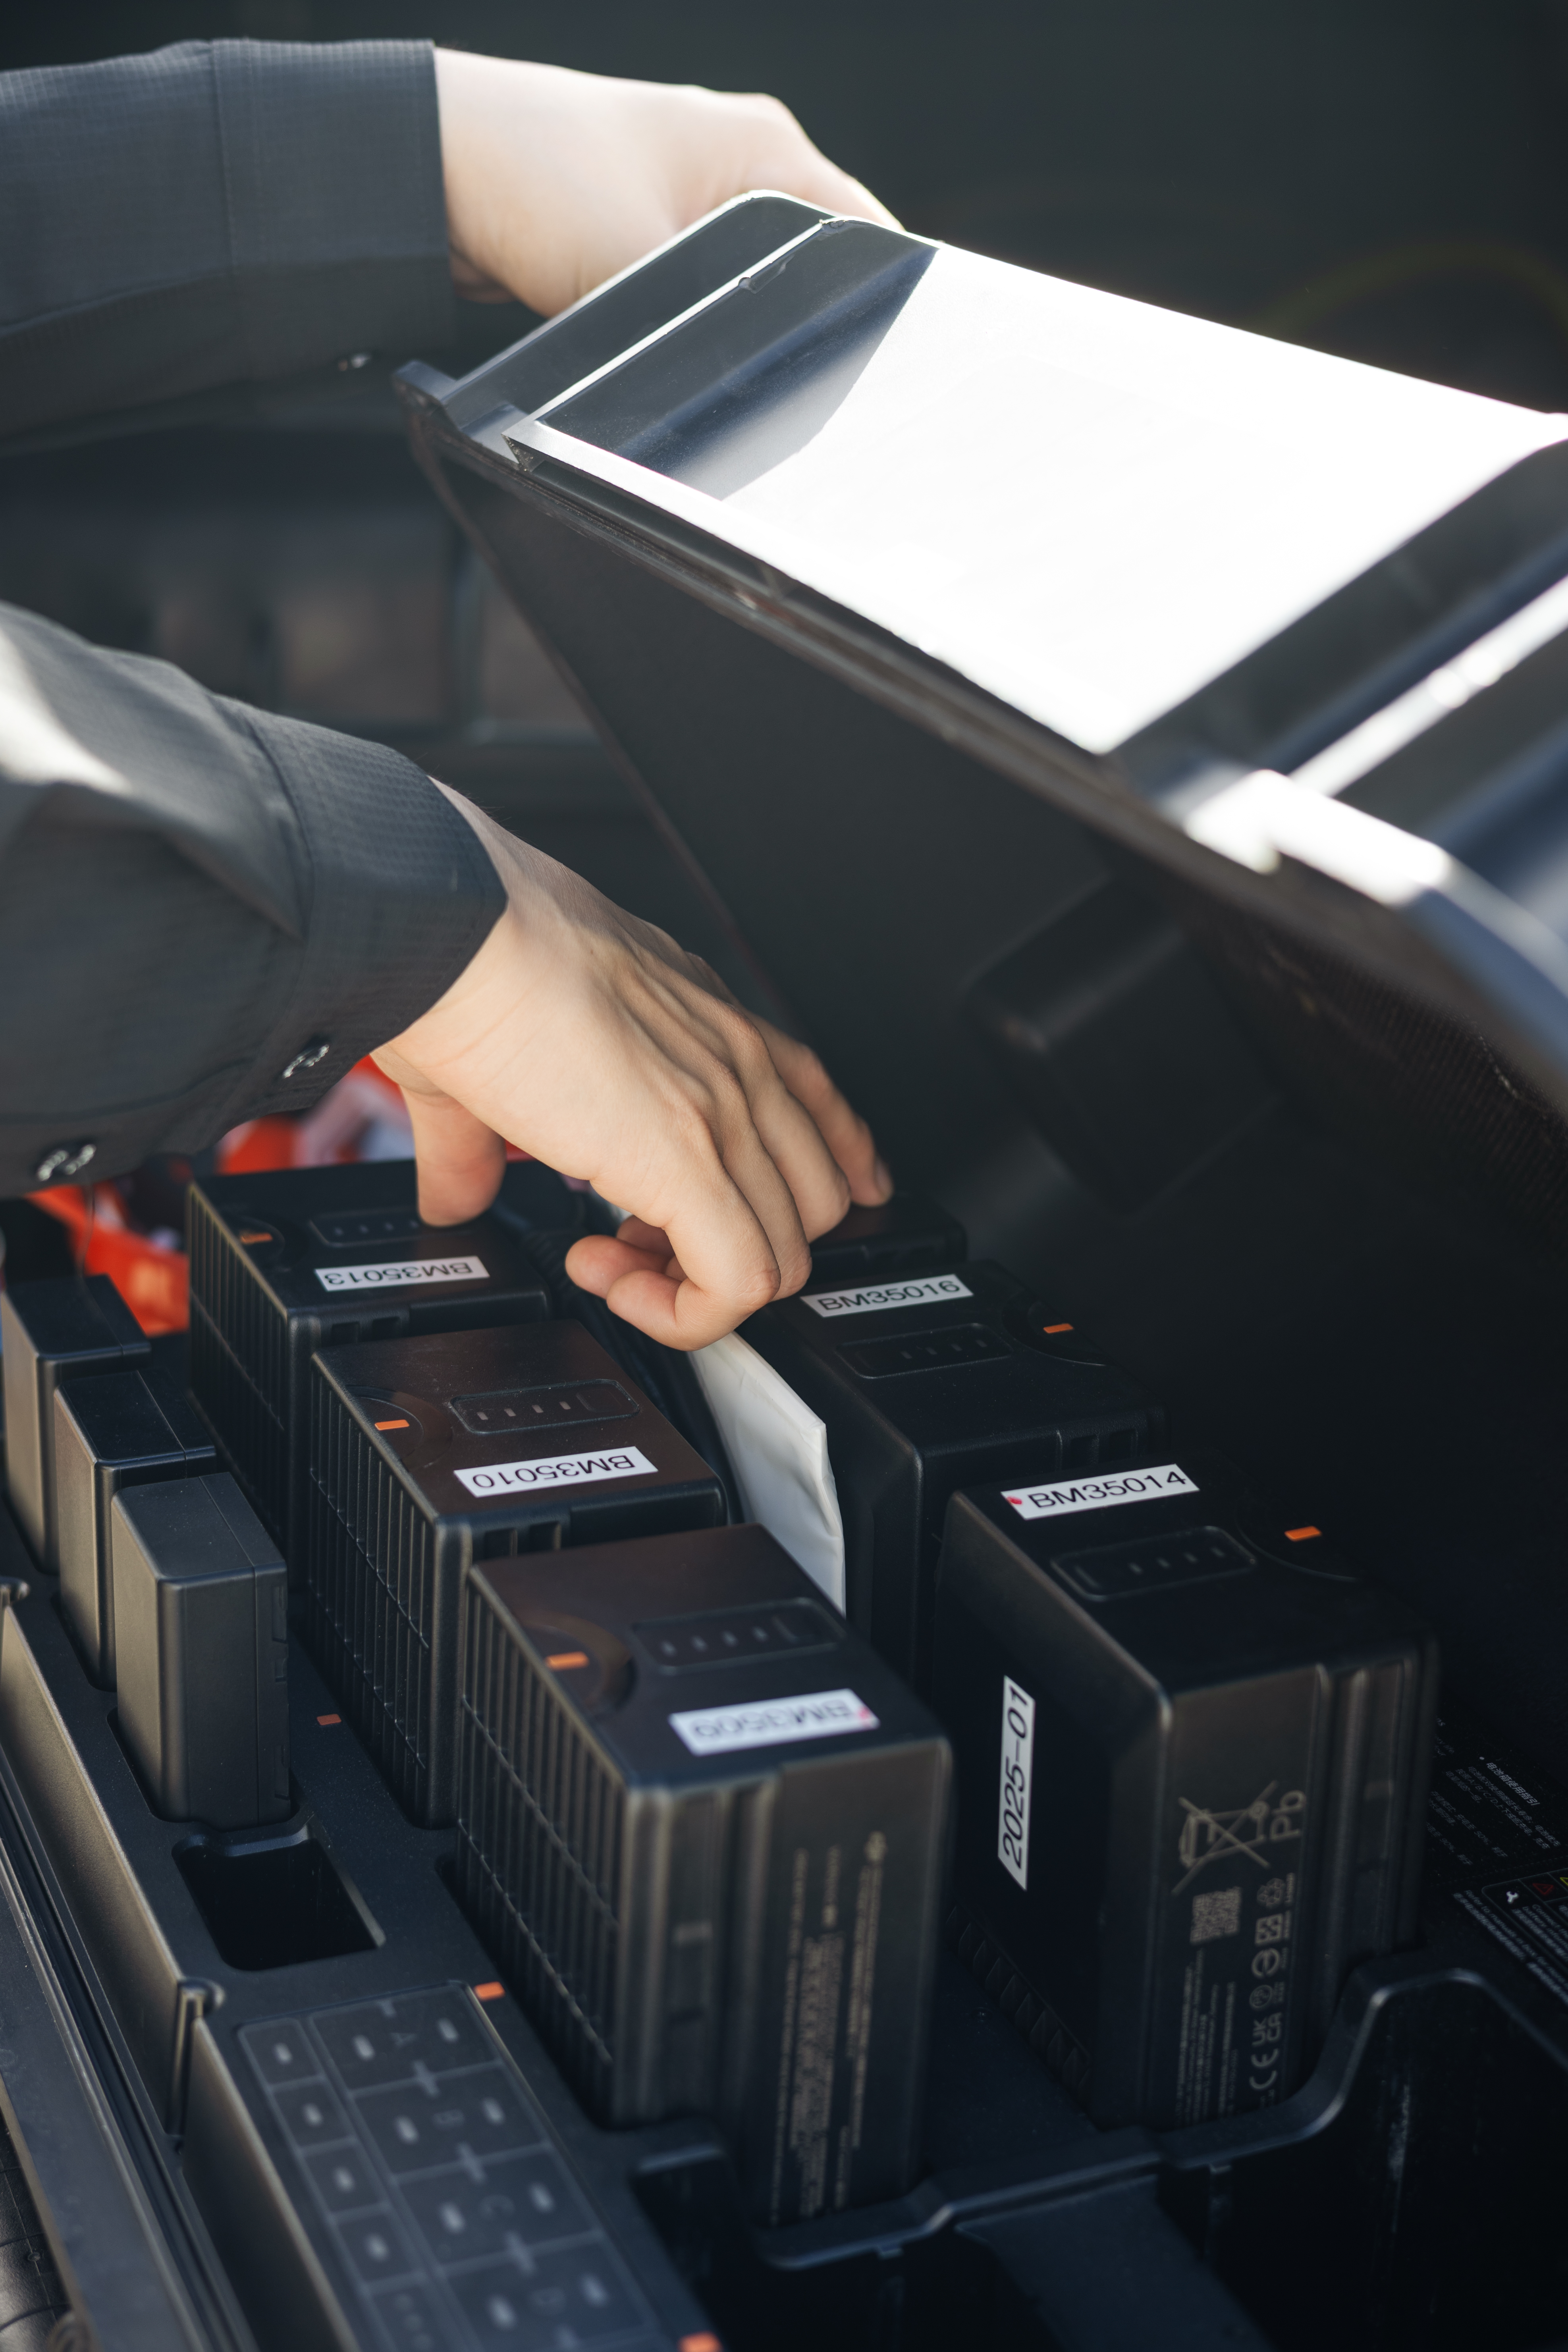
DAUCH 25 - Dauch

Our Process

From thermal imaging to anomaly detection

Each inspection requires appropriate sampling, processing, and analysis conditions to detect relevant temperature variations.
Window

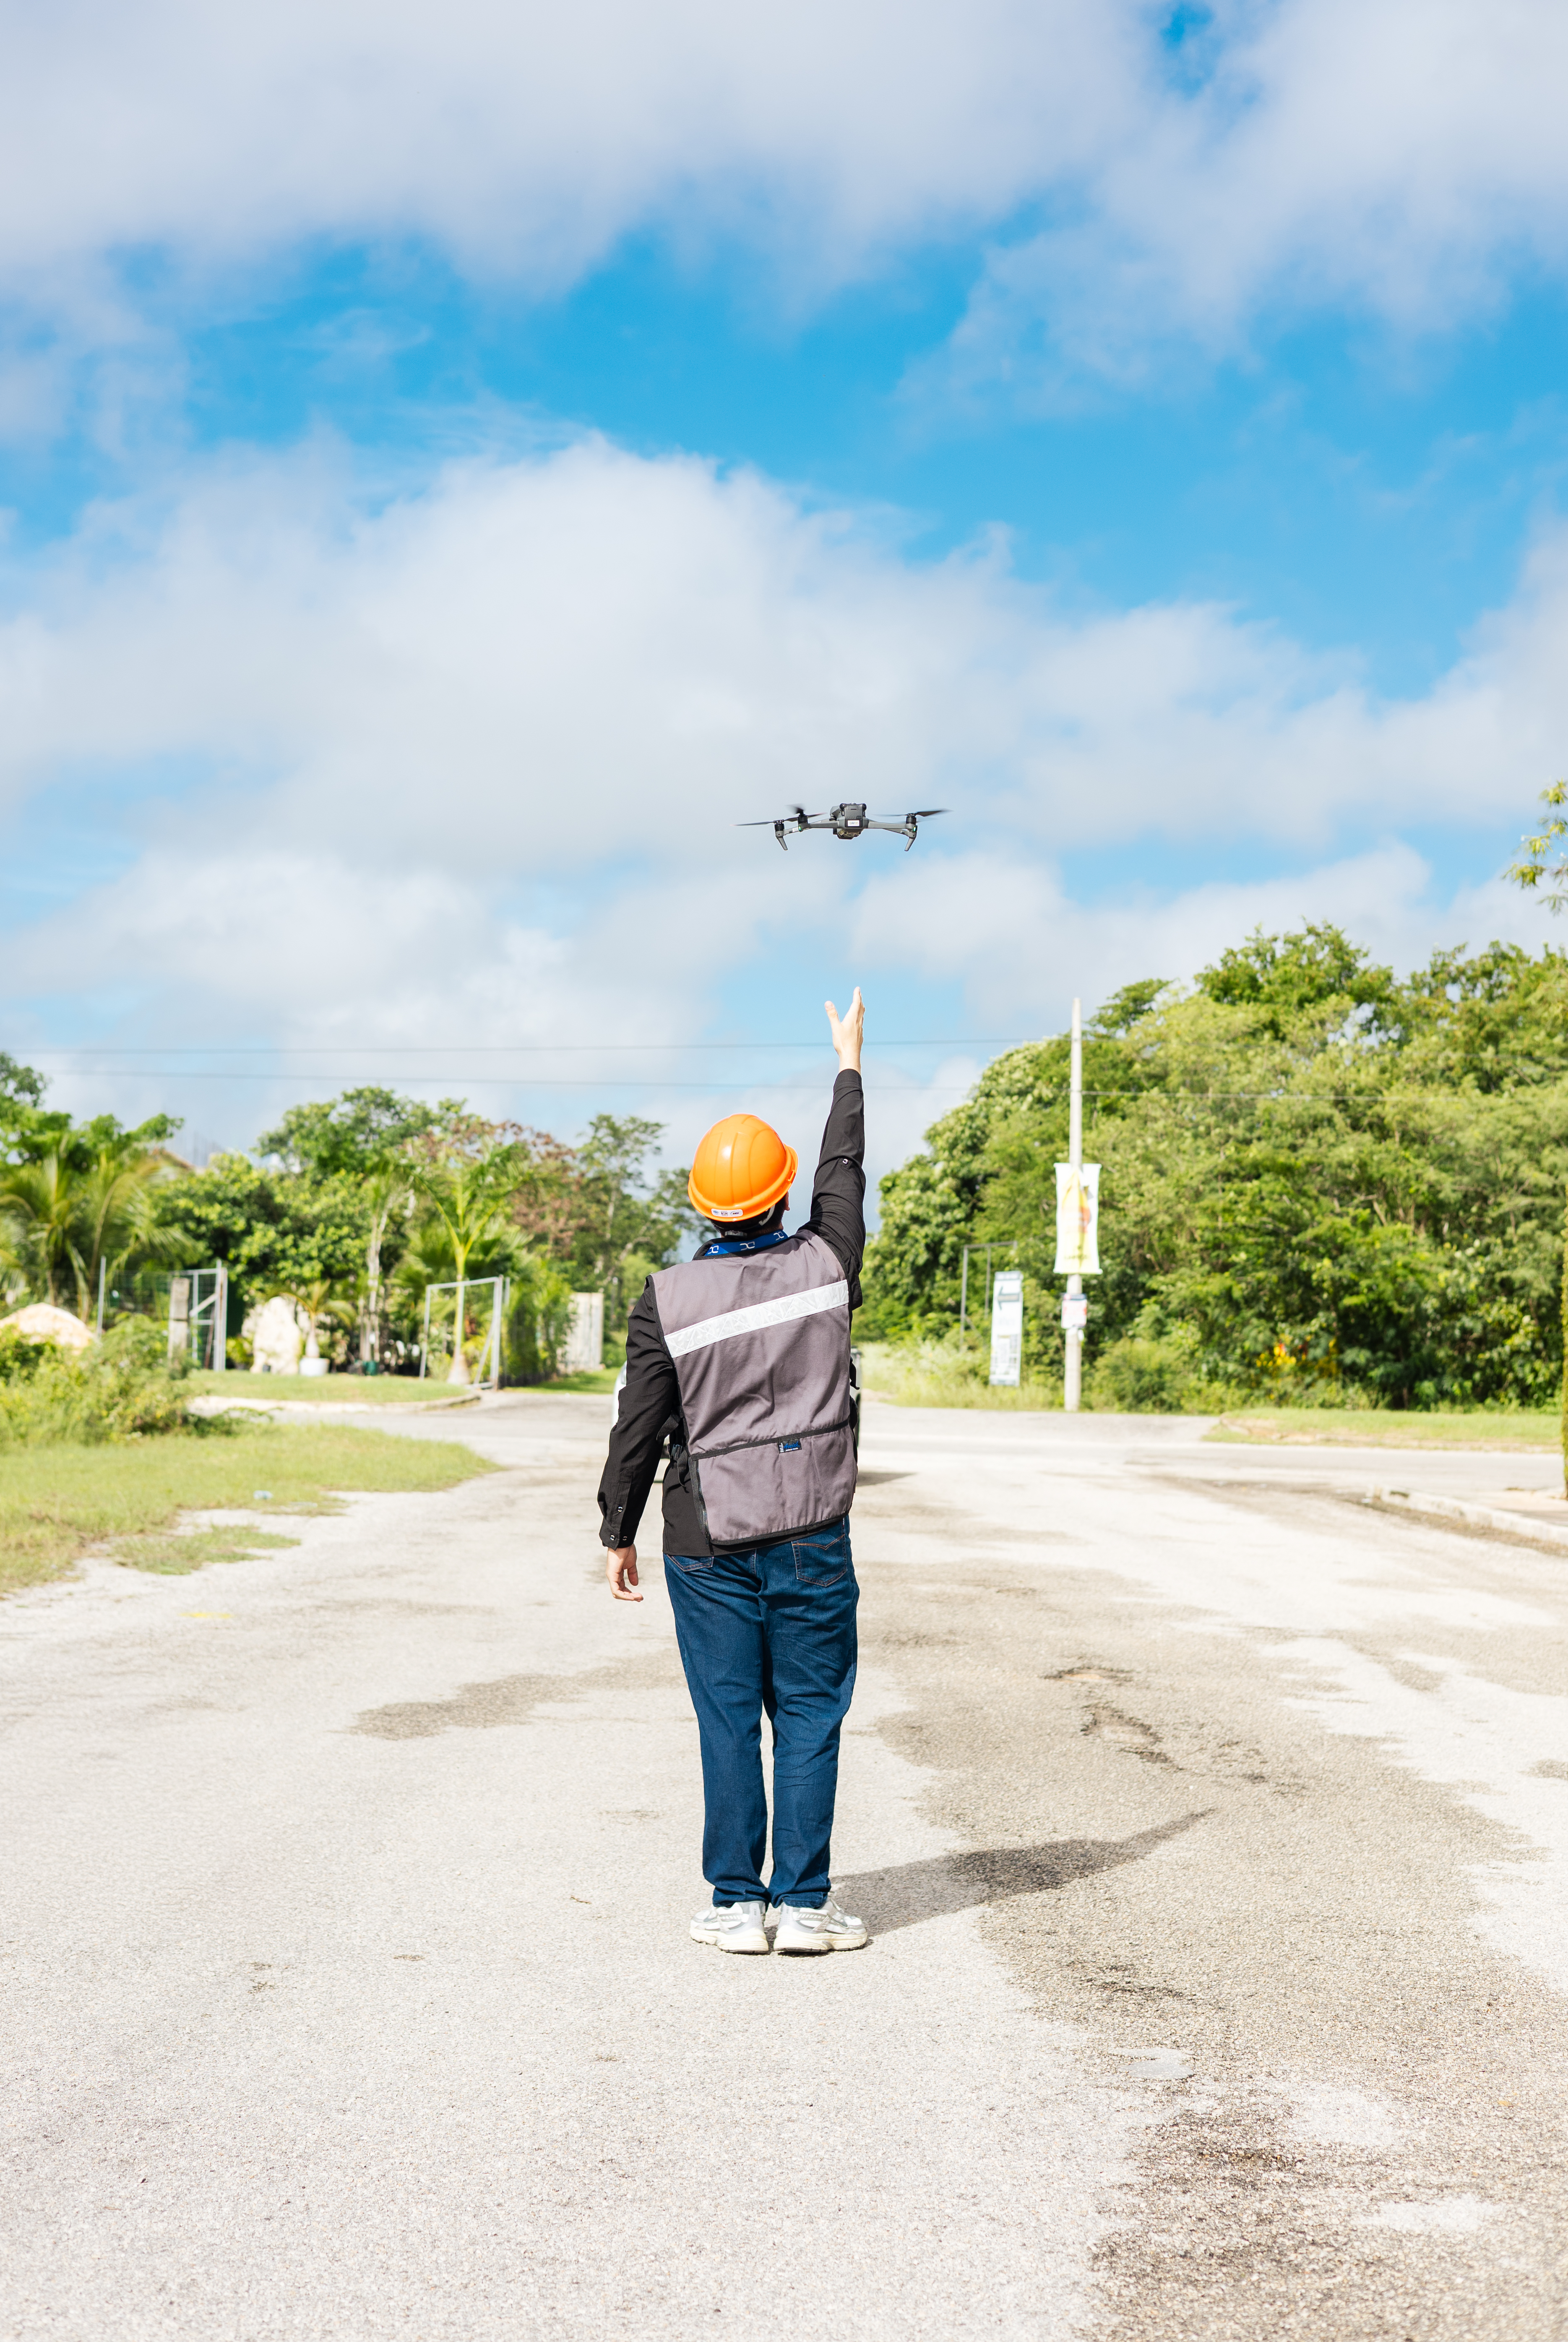
We determine appropriate hours and conditions.

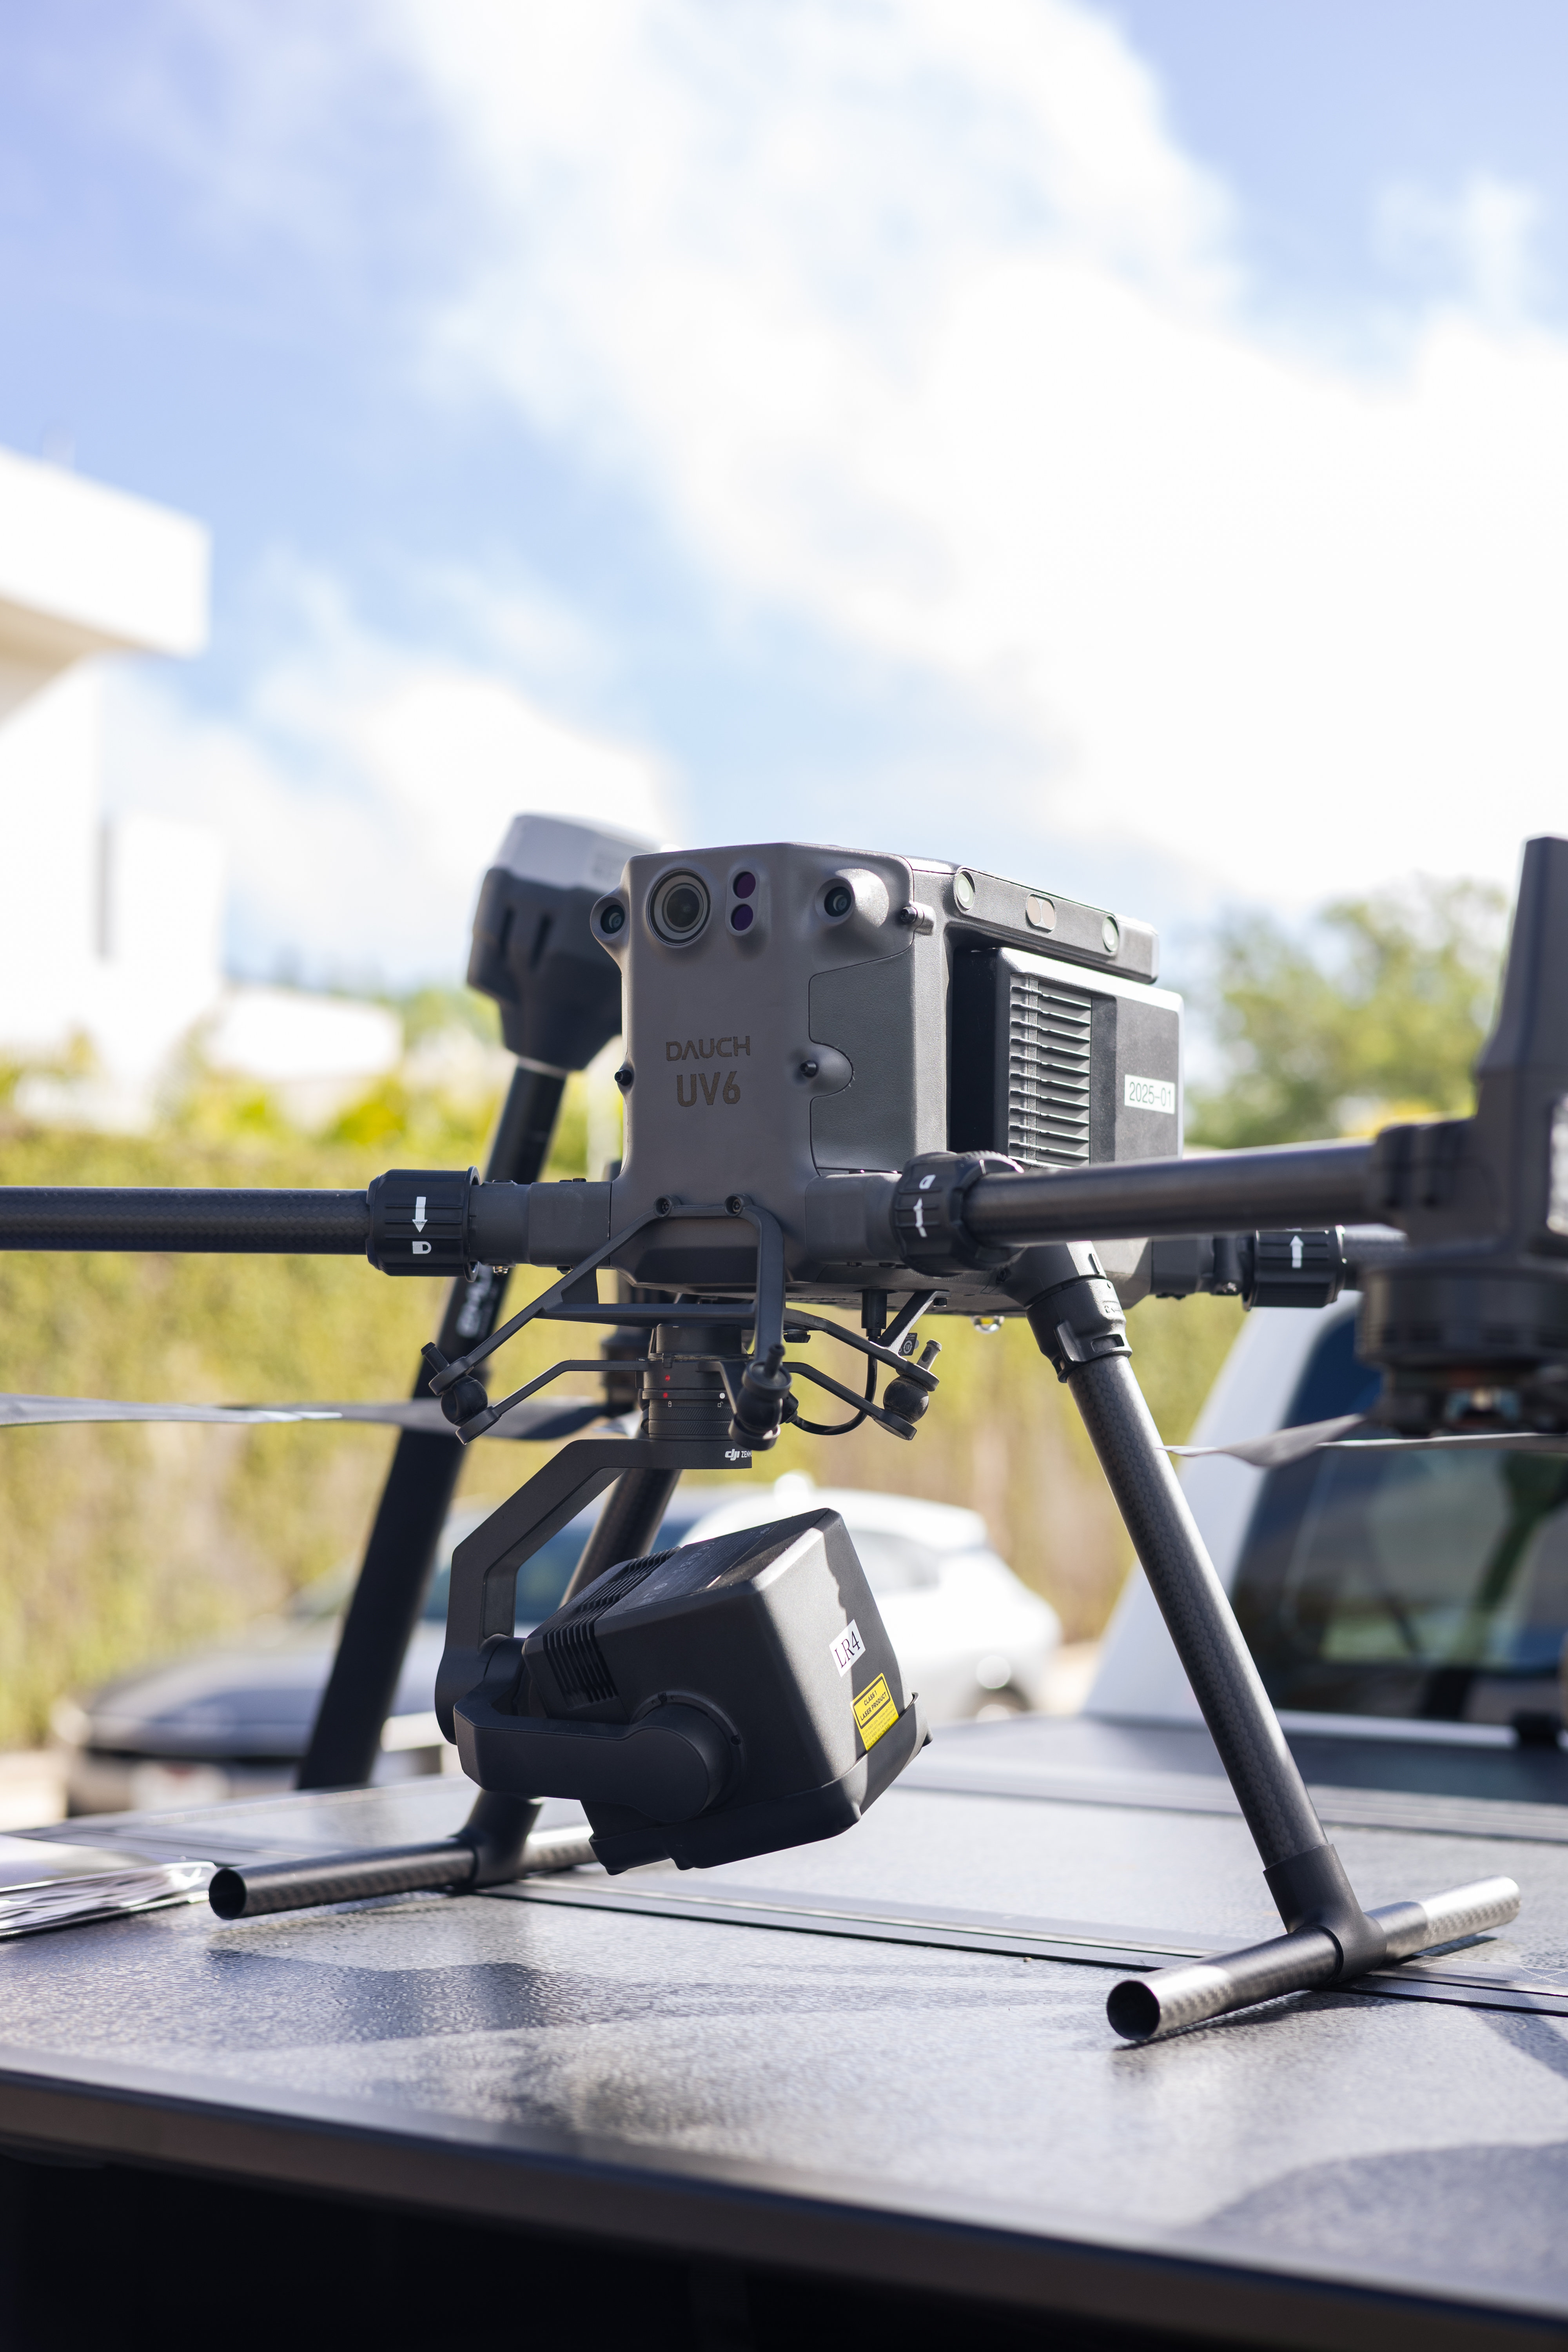
Flight

Simultaneous thermal and visual cameras.

Maps

Heat map and orthomosaic.

Analysis

Identification of anomalies.

Report

Prioritized Findings
DAUCH 26 - Dauch DAUCH 46 - Dauch Home Water Heater - Dauch DAUCH 81 1 - Dauch planning - Dauch
Capabilities

What can temperature differences?

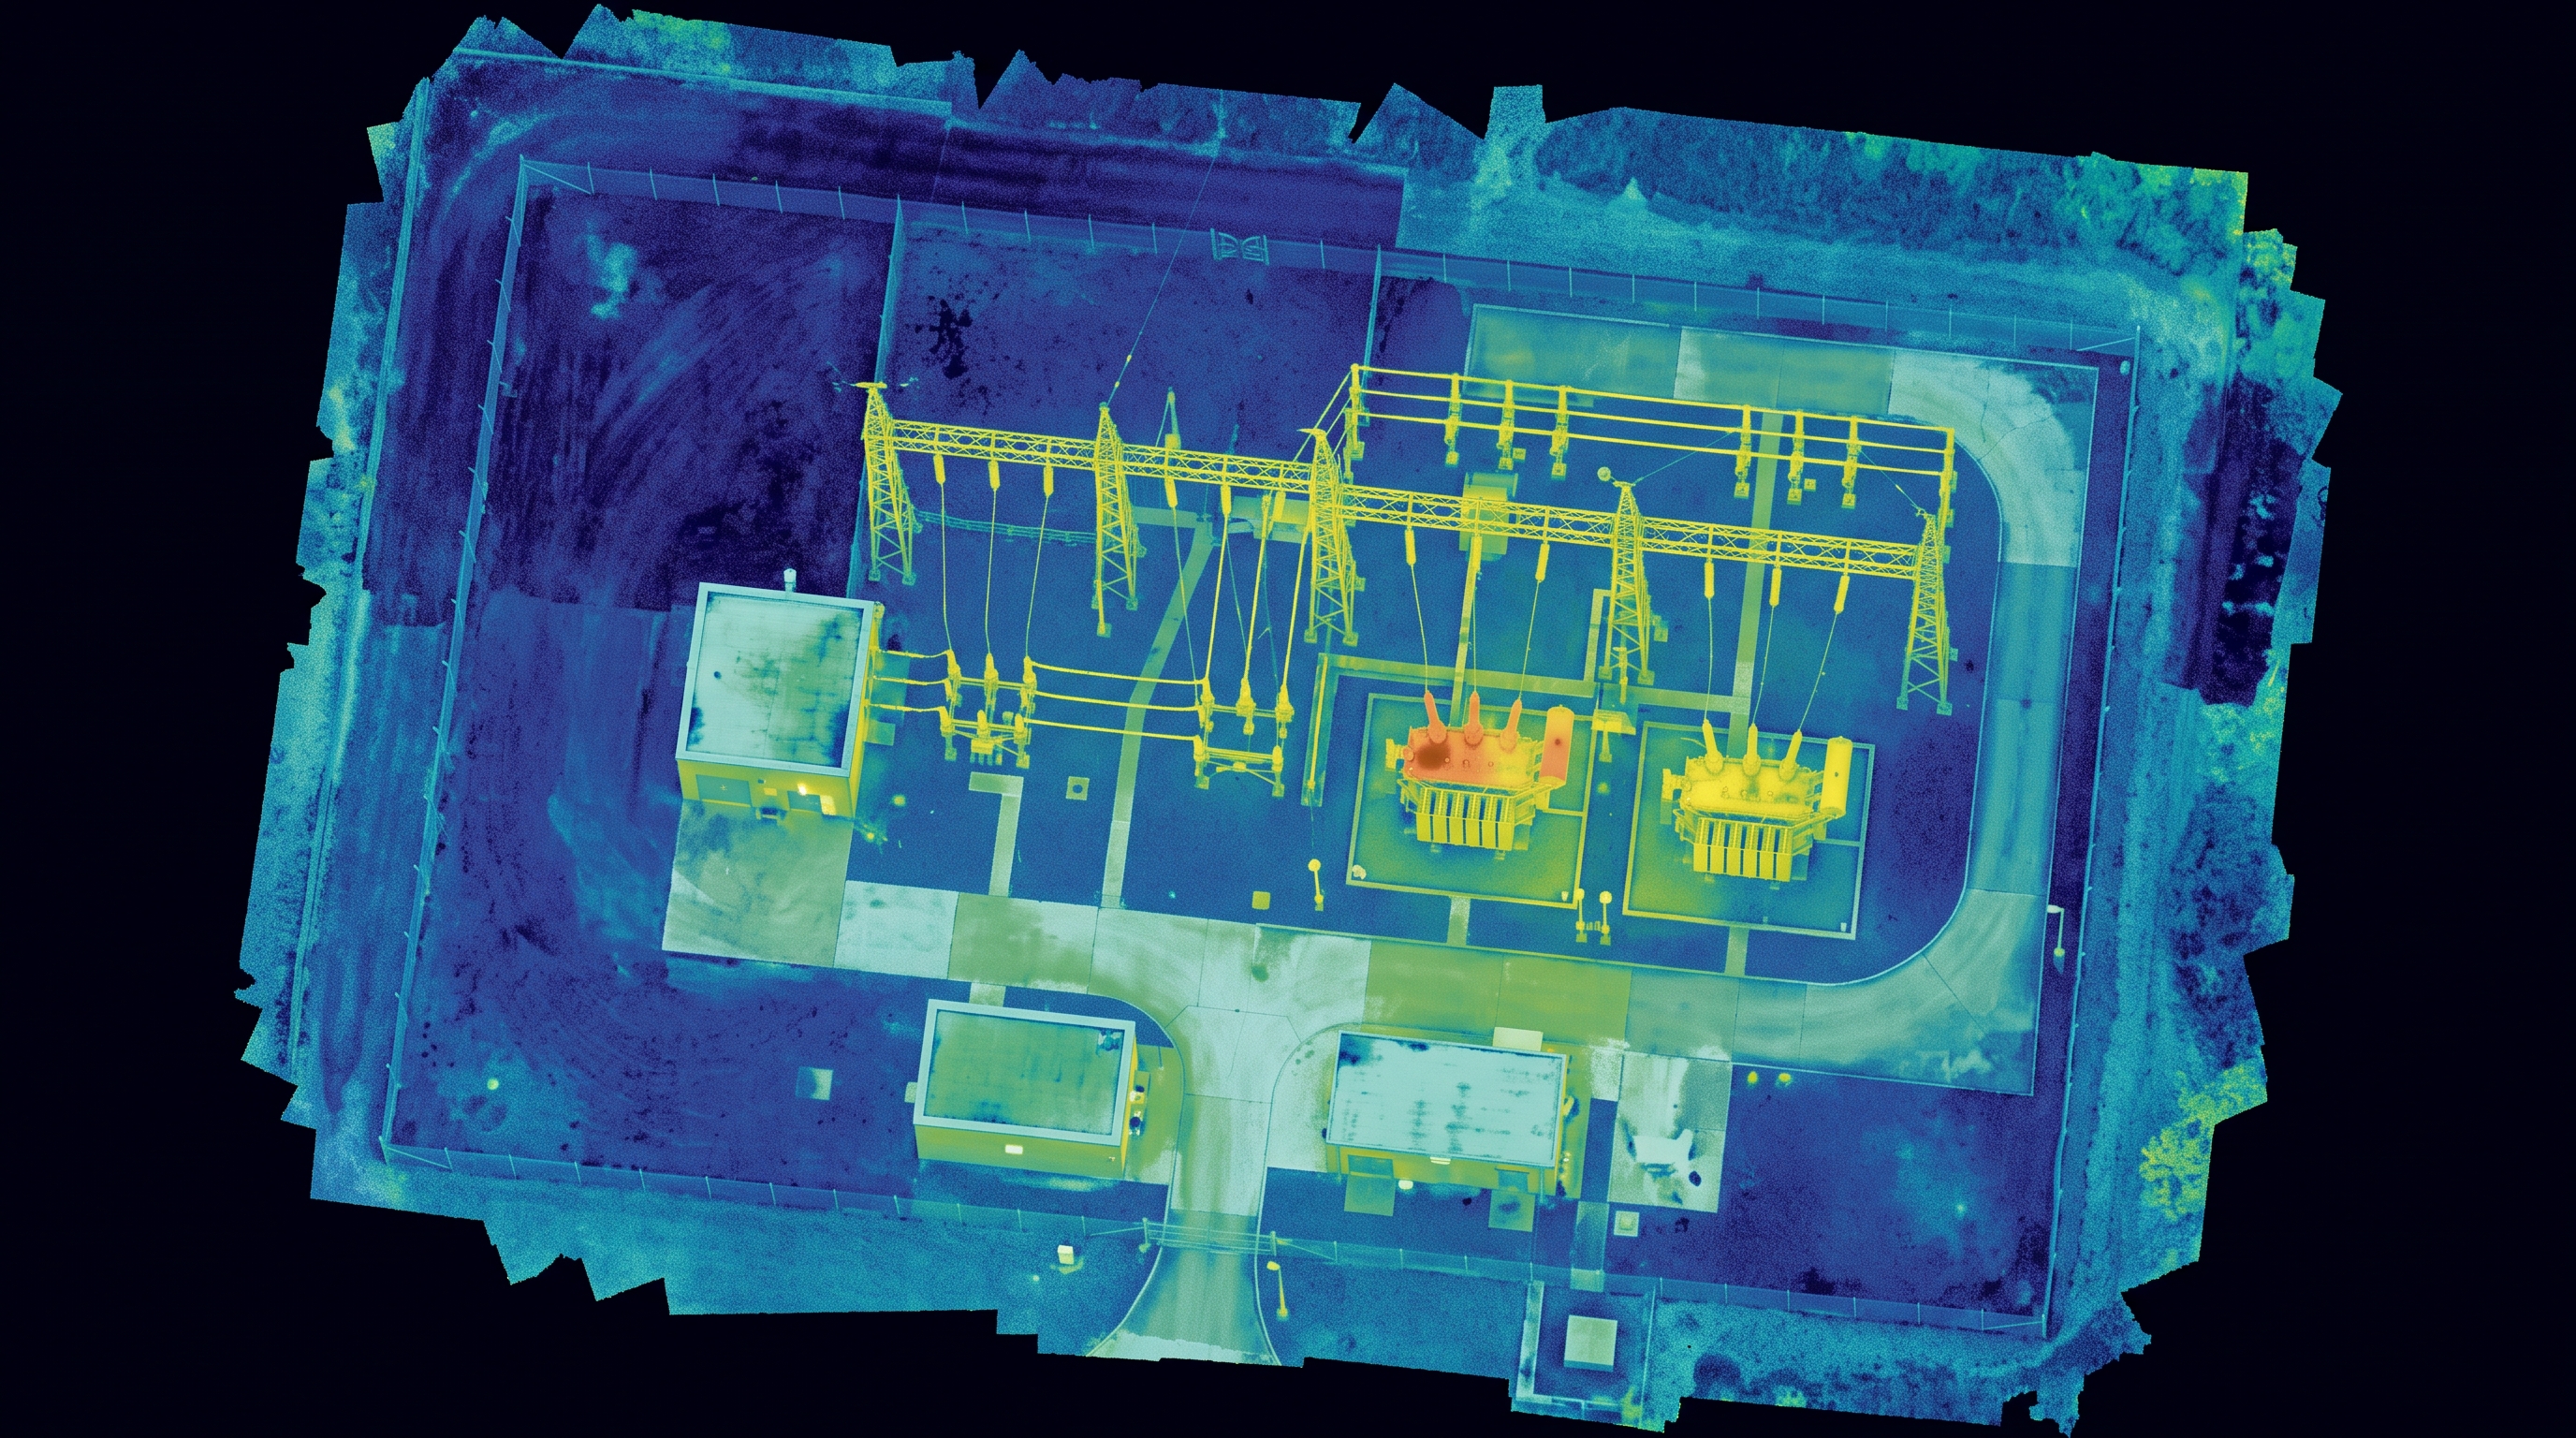
Electrical Overheating

Points with abnormal temperatures in electrical equipment and installations.

Problems with Solar Panels

Temperature differences that may indicate problems with modules and cells.

Potential wet areas

Temperature patterns consistent with moisture or leaks that require evaluation.

Heat Loss in Buildings

Temperature fluctuations associated with possible insulation deficiencies.

Electrical Overheating - Dauch Solar Panels - Dauch Leaks and Moisture - Dauch Building Heating Systems - Dauch
Scope and Considerations

Detect an anomaly is just the first step

Temperature differences may indicate potential anomalies, but interpreting them correctly requires taking into account environmental conditions, materials, and the characteristics of each surface.

Surface Temperature Measurement

Thermography captures the thermal radiation emitted by the external surface; therefore, it does not, on its own, identify the internal root cause of the anomaly.

Sensitivity to environmental and material conditions

The accuracy of the results varies depending on the time of day, solar radiation, wind, and the emissivity of the material being inspected.

Requirement for Specialized Equipment for Gas Leaks

Visual gas detection is not performed using conventional thermal cameras; it requires specific optical gas imaging (OGI) technology.

RESULTS AND DELIVERABLES

Thermal information for assessing and taking action

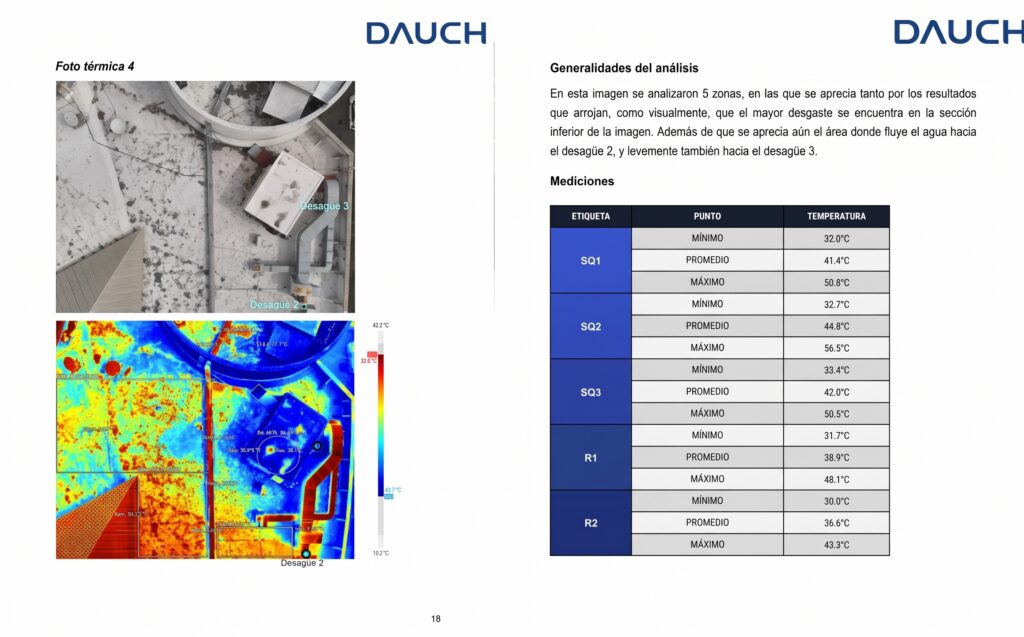
We convert the results of each inspection into maps, images, and technical reports that allow us to locate and document potential anomalies, facilitating their assessment and the planning of maintenance actions.
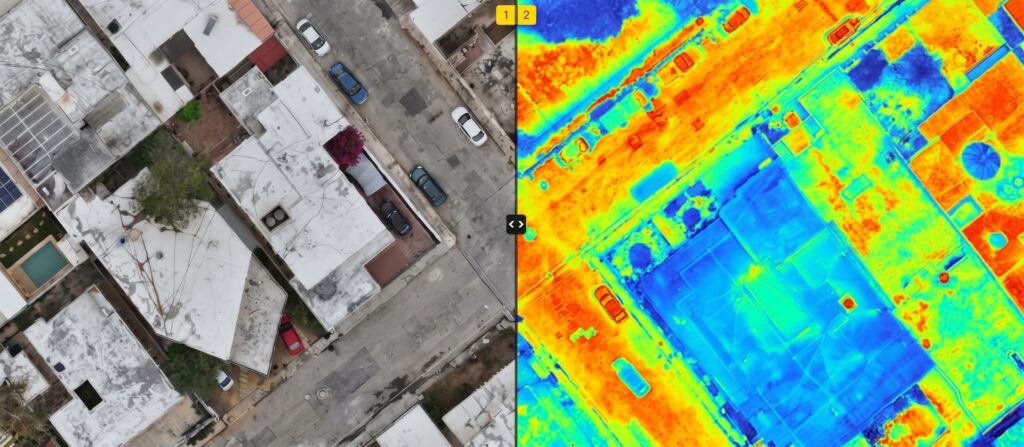
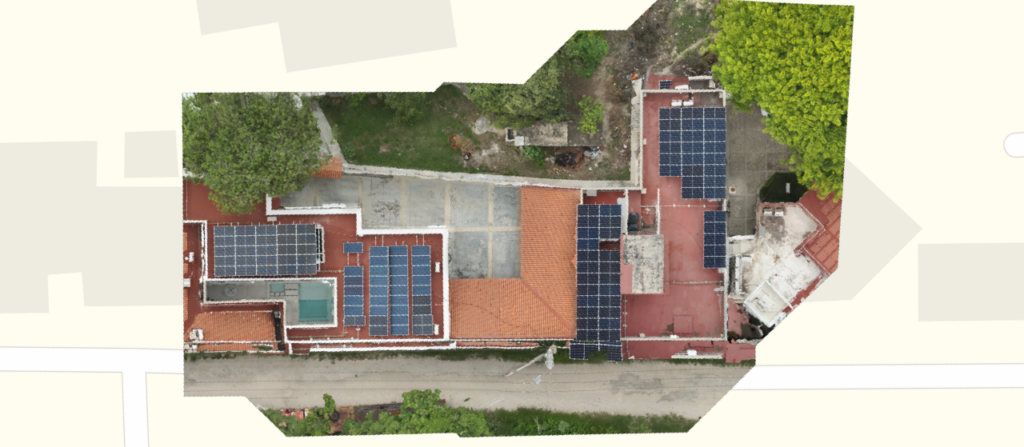
heat map - Dauch

Temperatures by Region

Heat map

Visual Orthomosaics - Dauch

Visual Context of the Site

Visual orthomosaic

Technical Report on Heating - Dauch

Locations of and documentation for findings

Anomaly Report with Thermal and Visual Images

modeling term - Dauch

To review and submit

3D Model

Processing

The informationCorrectchanges the
way we
intervene

Thermal Diagnostics for Decision-Making

Learn how we use thermal imaging to identify areas of interest and provide technical information that helps determine where to take action.

Real-Life Case · Thermal Imaging

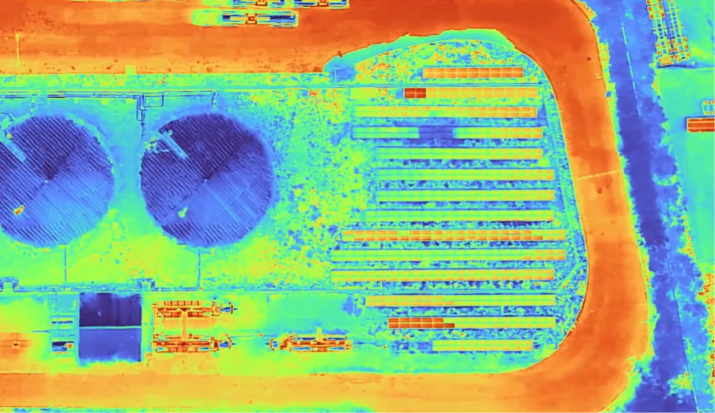
Solar Photovoltaic Plant: Thermal Assessment of 716 Solar Panels

01 · The Challenge

Assess the condition of a photovoltaic plant covering more than 37,000 m² and identify defects invisible to the human eye, without having to manually inspect more than 700 cells.

02 · How did we do it?

In a single flight, we scan the photovoltaic system using thermal sensors and generate a 3D digital twin and an orthomosaic of the plant.

The heat map instantly revealed the hotspots caused by malfunctions.

03 · What did we get?

15 panelsrequire urgent maintenance due to critical malfunctions
126 panelsshow initial wear
89%of the system is operating at optimal performance

The value of the results: the exact coordinates of each fault, allowing us to address the root cause of the problem and optimize the plant without having to manually check more than 700 cells.

We'll help you determine whether this is the right technology for your project

Do you have facilities that need to be inspected?